
Workout Wednesdays videos
H.A.T. Workout Wednesday is inspired and adapted from workout-wednesday.com, where we have sharing sessions to recreate visualisations, share analytics methods using tools like Tableau, R or Python, and discuss data storytelling or analysis concepts. Check out our past sessions in the videos below!
14 items
19 August 2026
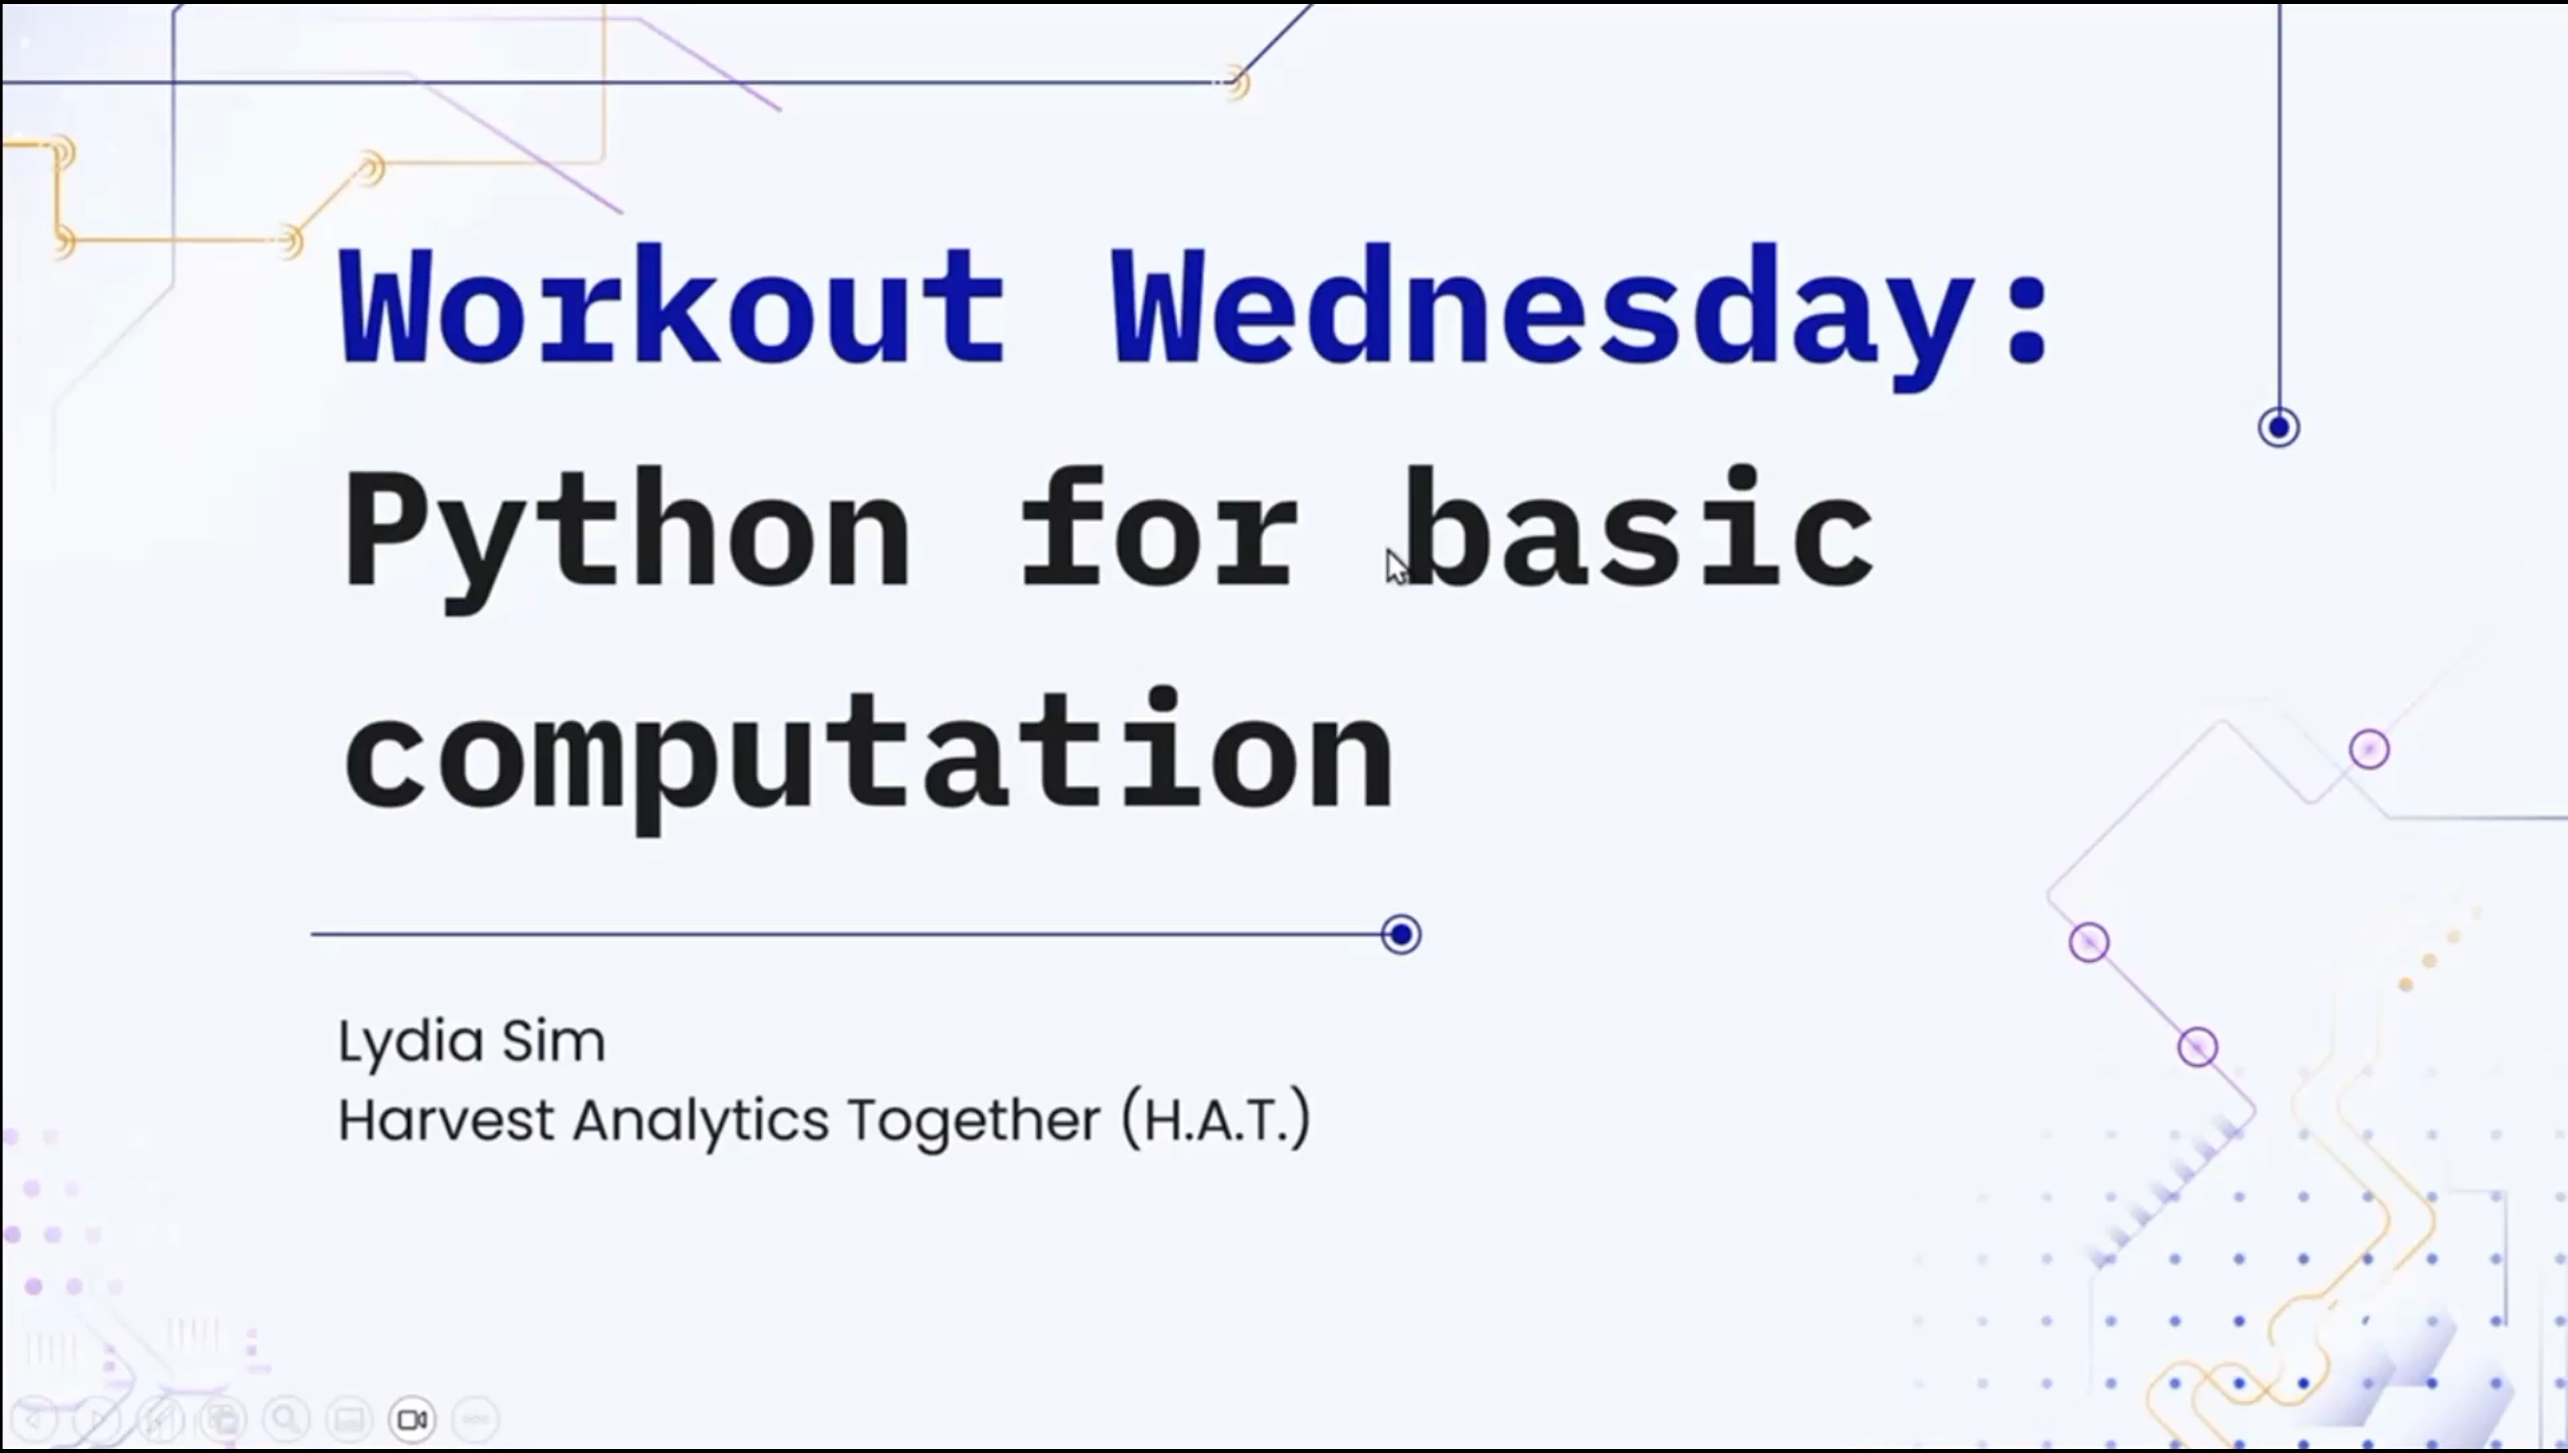
Basic Computation in Python
When the number of records of data in your sheet starts to run in the thousands, it becomes difficult to perform operations manually. That’s when having a little coding knowledge can help. Think of Python as your digital magic wand, ready to help execute calculations almost instantly. This video covers tips and tricks to get you started with Python for basic computation - Arithmetic operations, Aggregation, Transforming columns and String operations.
22 July 2026
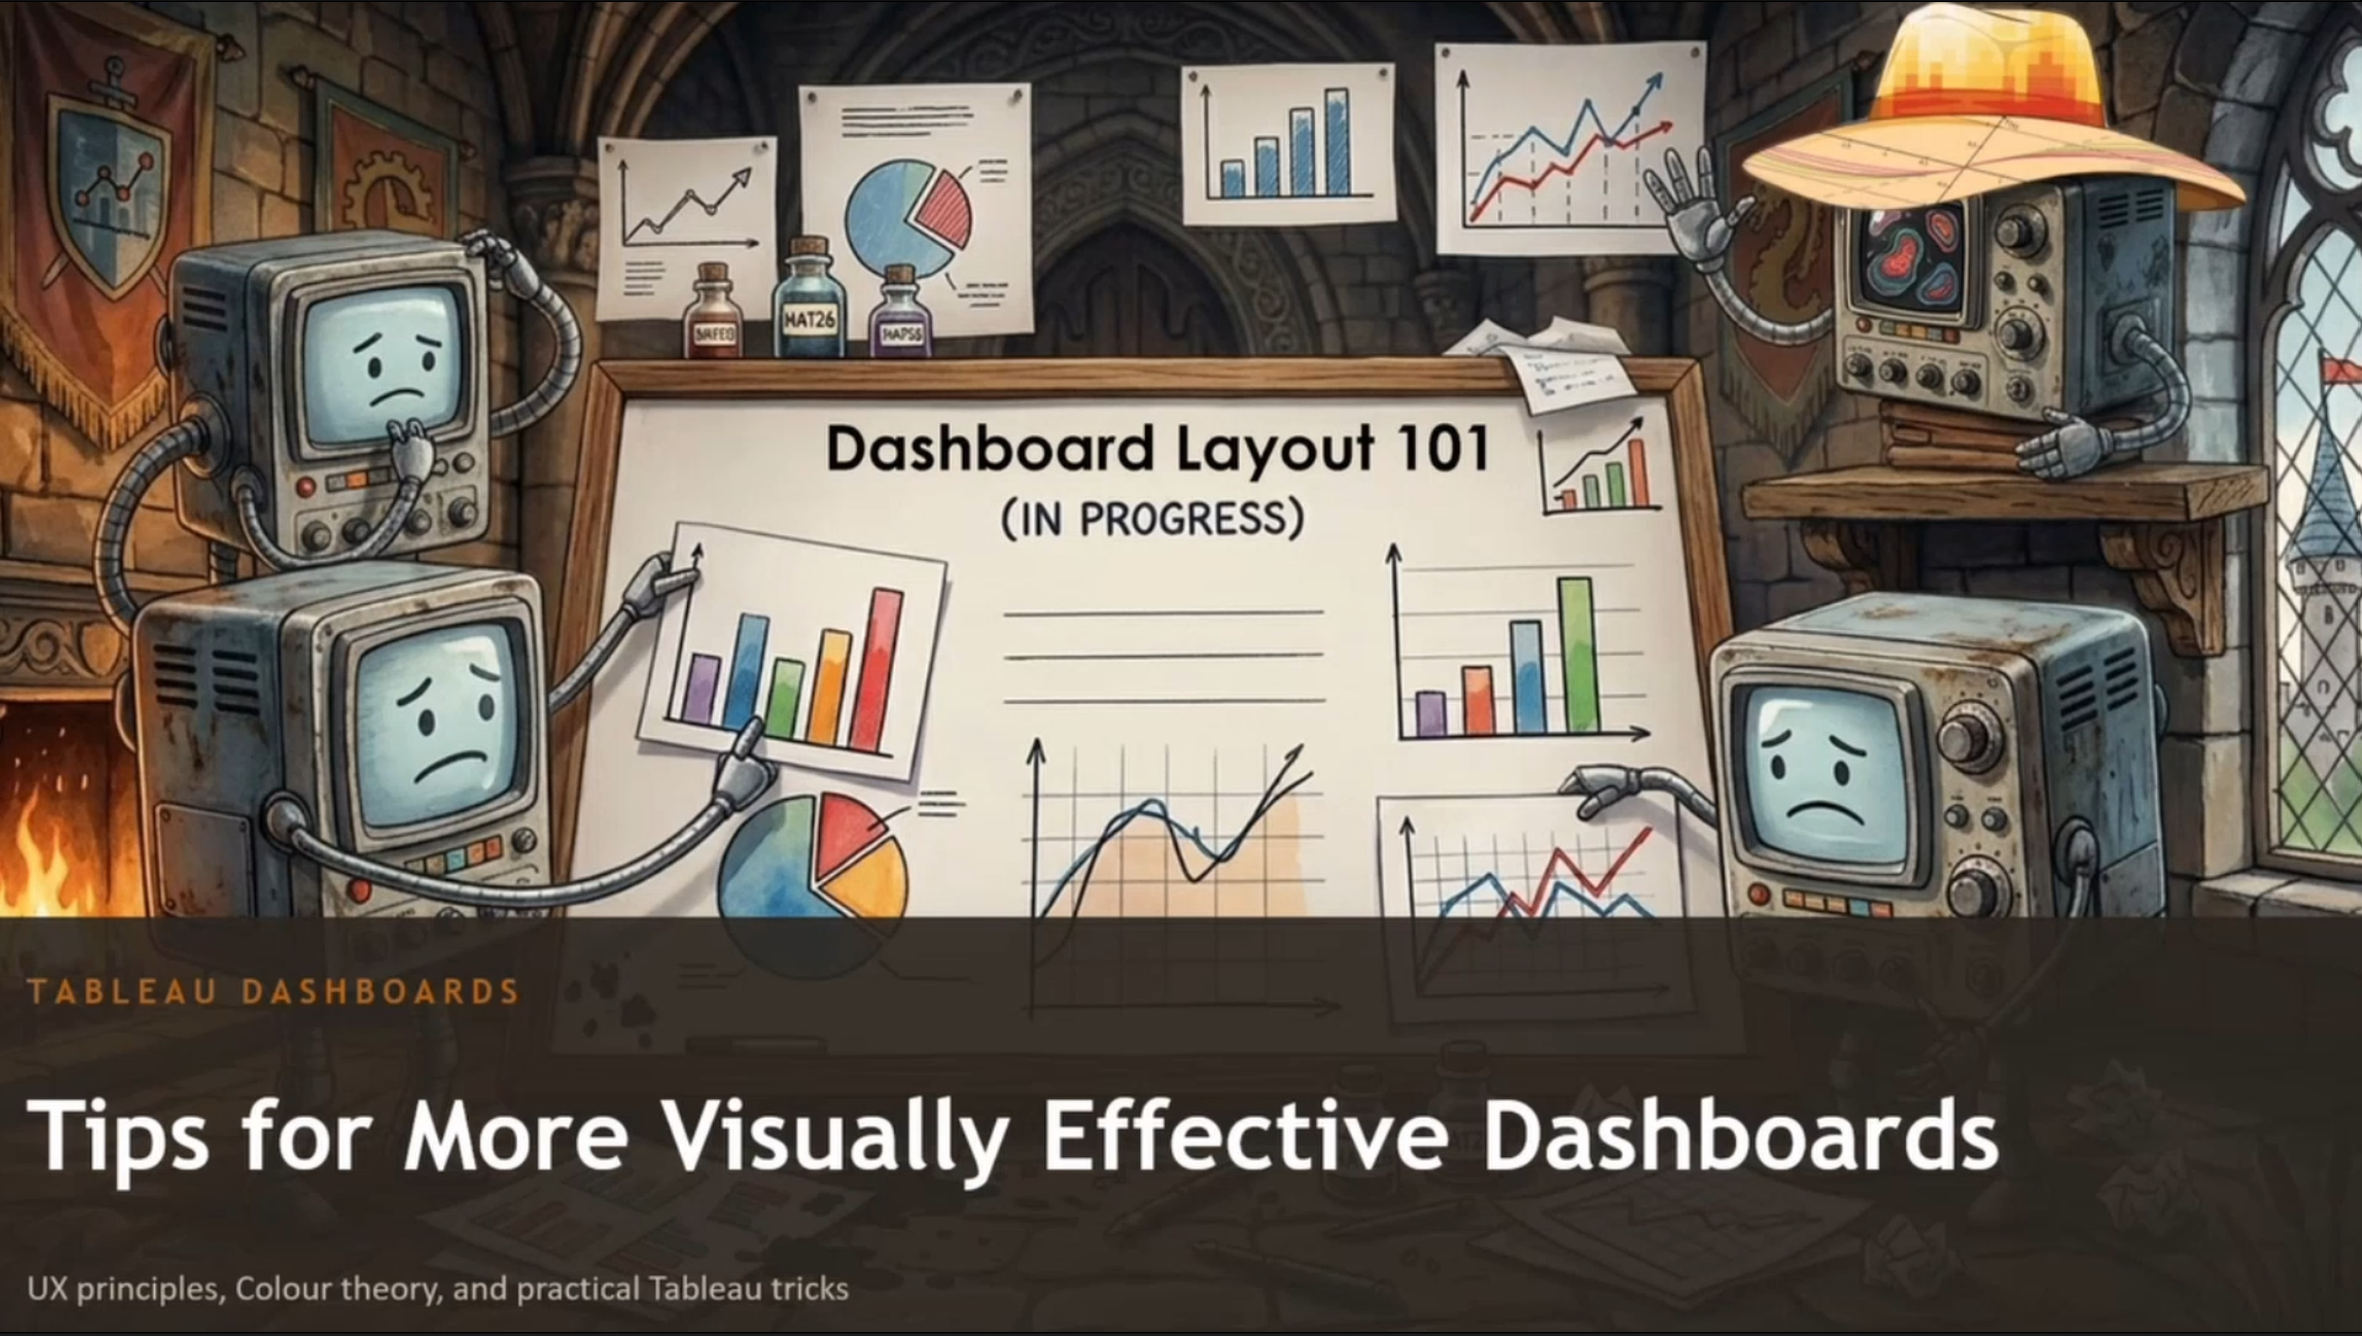
Dashboard Design 101
Tips and tricks for designing visually compelling dashboards. Learn how to plan what to appear on your dashboards, and the visual principles that help you decide how to best present your data so it can be easily understood by your audience.
24 June 2026
Basic Data Wrangling with Python
This video shares how to use Python to clean, transform, and make sense of your datasets. Gain experience with valuable tools like the pandas library that help greatly when dealing with messy real-world data.
20 May 2026
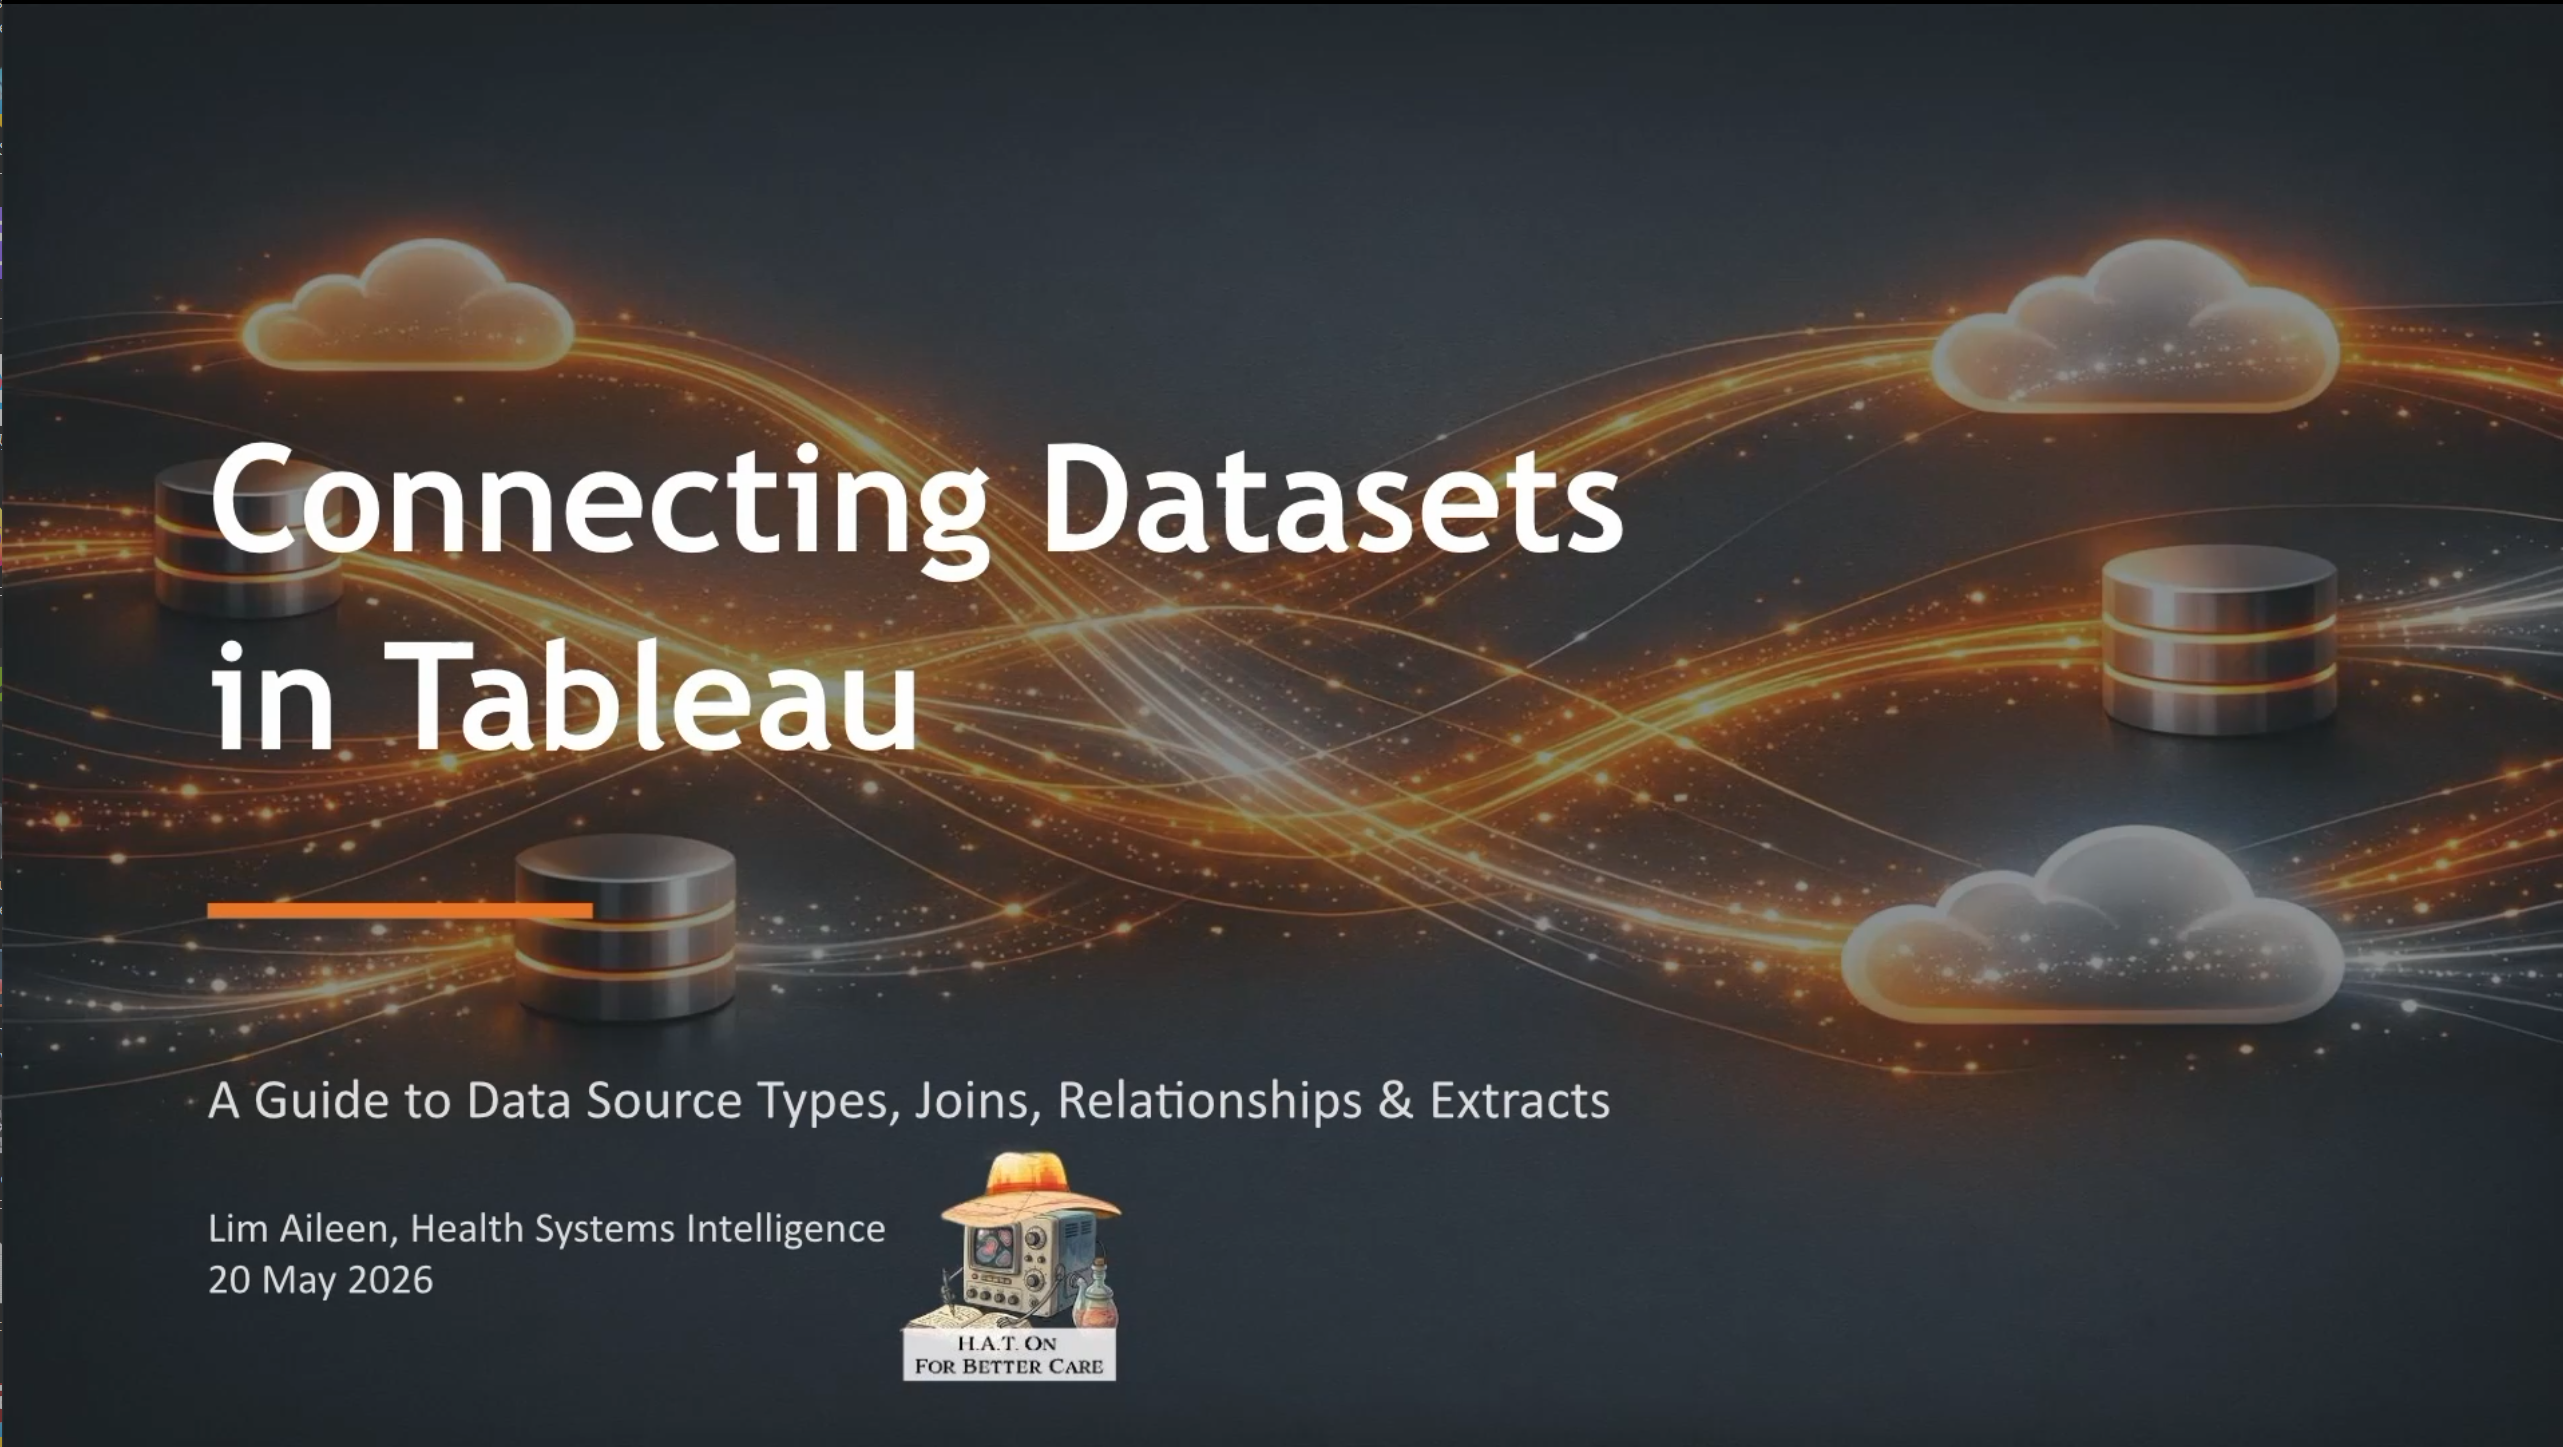
Connecting Datasets in Tableau
When we do analysis, you’ll often find the information you need sits in different reports that are likely also managed by other people. The information’s all there, but how do we get everything to make sense together? Use Joins! This video will show you how connect datasets so they only show the information you want to include.

3 September 2025
Mad About Data - Clinical Statistics with R (part 7)
In the final video of our series on R, we touch on creating visualizations of your data in R. Learn how to create Bar Charts, Line Plots and Scatter Plots with just a few lines of code, so you’ll have them ready when it’s time to present your findings.
3 September 2025
Mad About Data - Clinical Statistics with R (part 6)
In this video, we continue with tips on how to do Statistical Analysis in R. This time, we look at the R library Corplot, and how you can use it to perform a regression analysis.
3 September 2025
Mad About Data - Clinical Statistics with R (part 5)
In this video, we touch on how to do Statistical Analysis. Learn how to check for categorical variables, and how to perform a Chi Square Test, Fisher’s test and the Anova Test using R.
3 September 2025
Mad About Data - Clinical Statistics with R (part 4)
Part 4 of our video series on Clinical Statistics with R touches on how to create Tables, allowing you to better present and share your data with others.

3 September 2025
Mad About Data - Clinical Statistics with R (part 3)
In this video, we touch on good practices to adopt while scripting. Learn some tips and tricks to keep your code clean and tidy so it will be easy for anyone to reference in the future.
3 September 2025
Mad About Data - Clinical Statistics with R (part 2)
Part 2 of this series on Clinical Statistics with R shows how to do data processing. Learn how to change data fields, address missing data and outliers, and convert Categorical values into "1"s and "0"s for computation.